Reporting on BankingBridge Events in Google Analytics 4
NoteThere can be a 24-48 hour delay from when the first events are sent to when events are available for reporting in GA4 (provided you have completed all the steps in Adding Event Tracking and Configuring Google Analytics.
- Log in to Google Analytics.
- Navigate to the GA4 Property you referenced in the Tag Configuration.
- Set the Date Range (on the top-right) to include dates when events were sent.
- In the left-hand navigation pane, click Reports > Life-cycle > Engagement > Events. You should see a list of all events captured on your website.
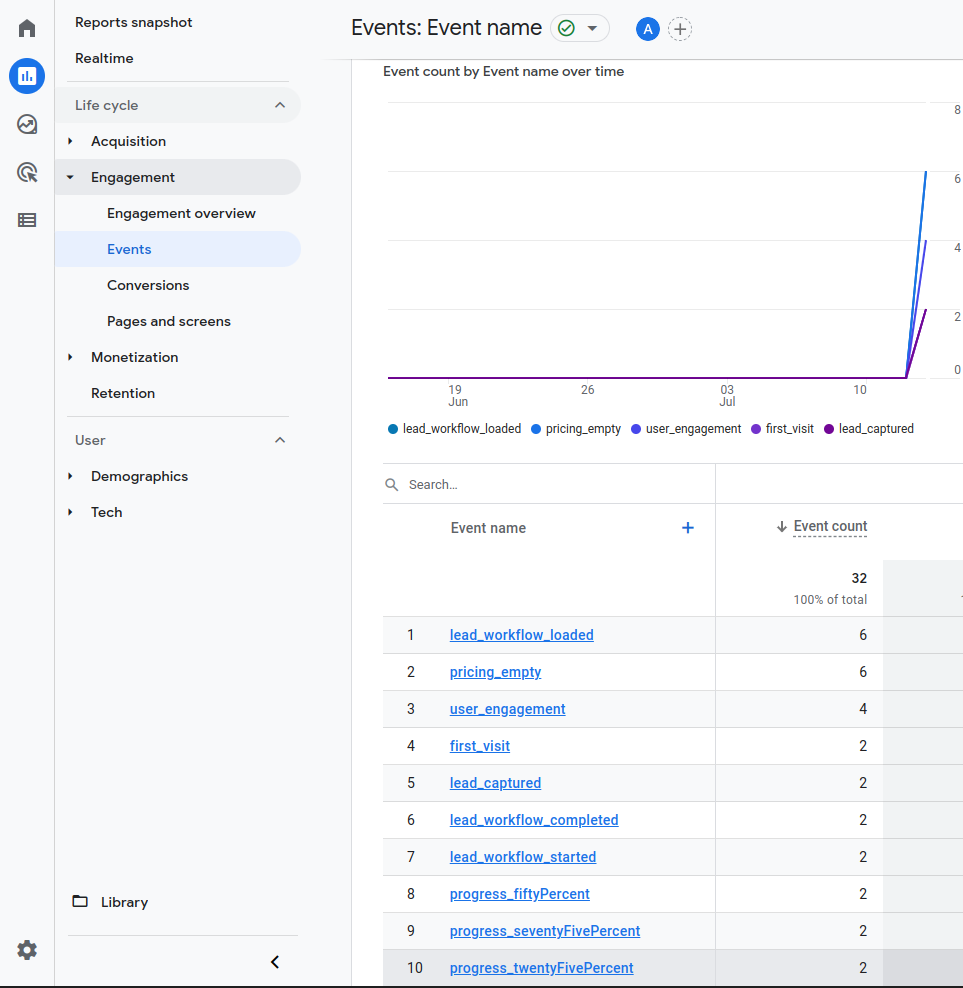
- Click
 to add a dimension to the chart.
 - Click Custom (Event Scoped) and select the Event Category dimension you created earlier. You will be returned to the Events report with the Event Category dimension showing.
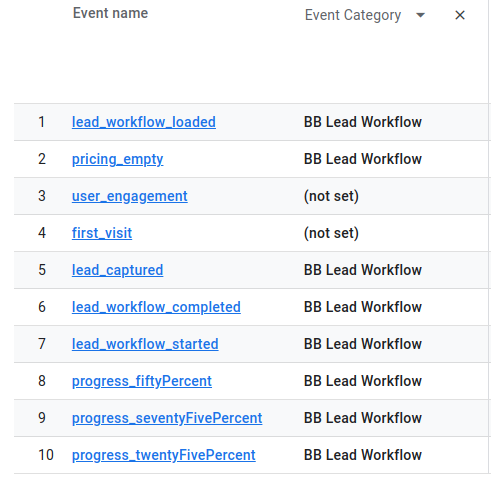
Events with the Category BB Lead Workflow were generated by the BankingBridge tool. These events fire in the following sequence:
- lead_workflow_loaded
- lead_workflow_started
- progress_twentyFivePercent
- progress_fiftyPercent
- progress_seventyFivePercent
- lead_workflow_completed
- lead_captured
The lead_captured event is sent when the user’s contact details are successfully submitted in the form.
Additional reporting options are available via GA4 Explorations or Google Data Studio.
Updated about 1 year ago
Did this page help you?